

Lauterbach Japan, Ltd.
The More Cores, the More Your Debugger Matters.
Microcontrollers and processors are becoming increasingly powerful and complex, while the size and complexity of embedded software continue to grow rapidly. We offer a range of debugger solutions designed to help embedded software engineers tackle these challenges.
At this exhibition, we will showcase "μTrace", an integrated debugger with trace capabilities; High-Speed Serial Trace, which captures large volumes of trace data reliably via PCIe; and "AI-Assisted Debugging", making its debut at this exhibition.
Products & Services
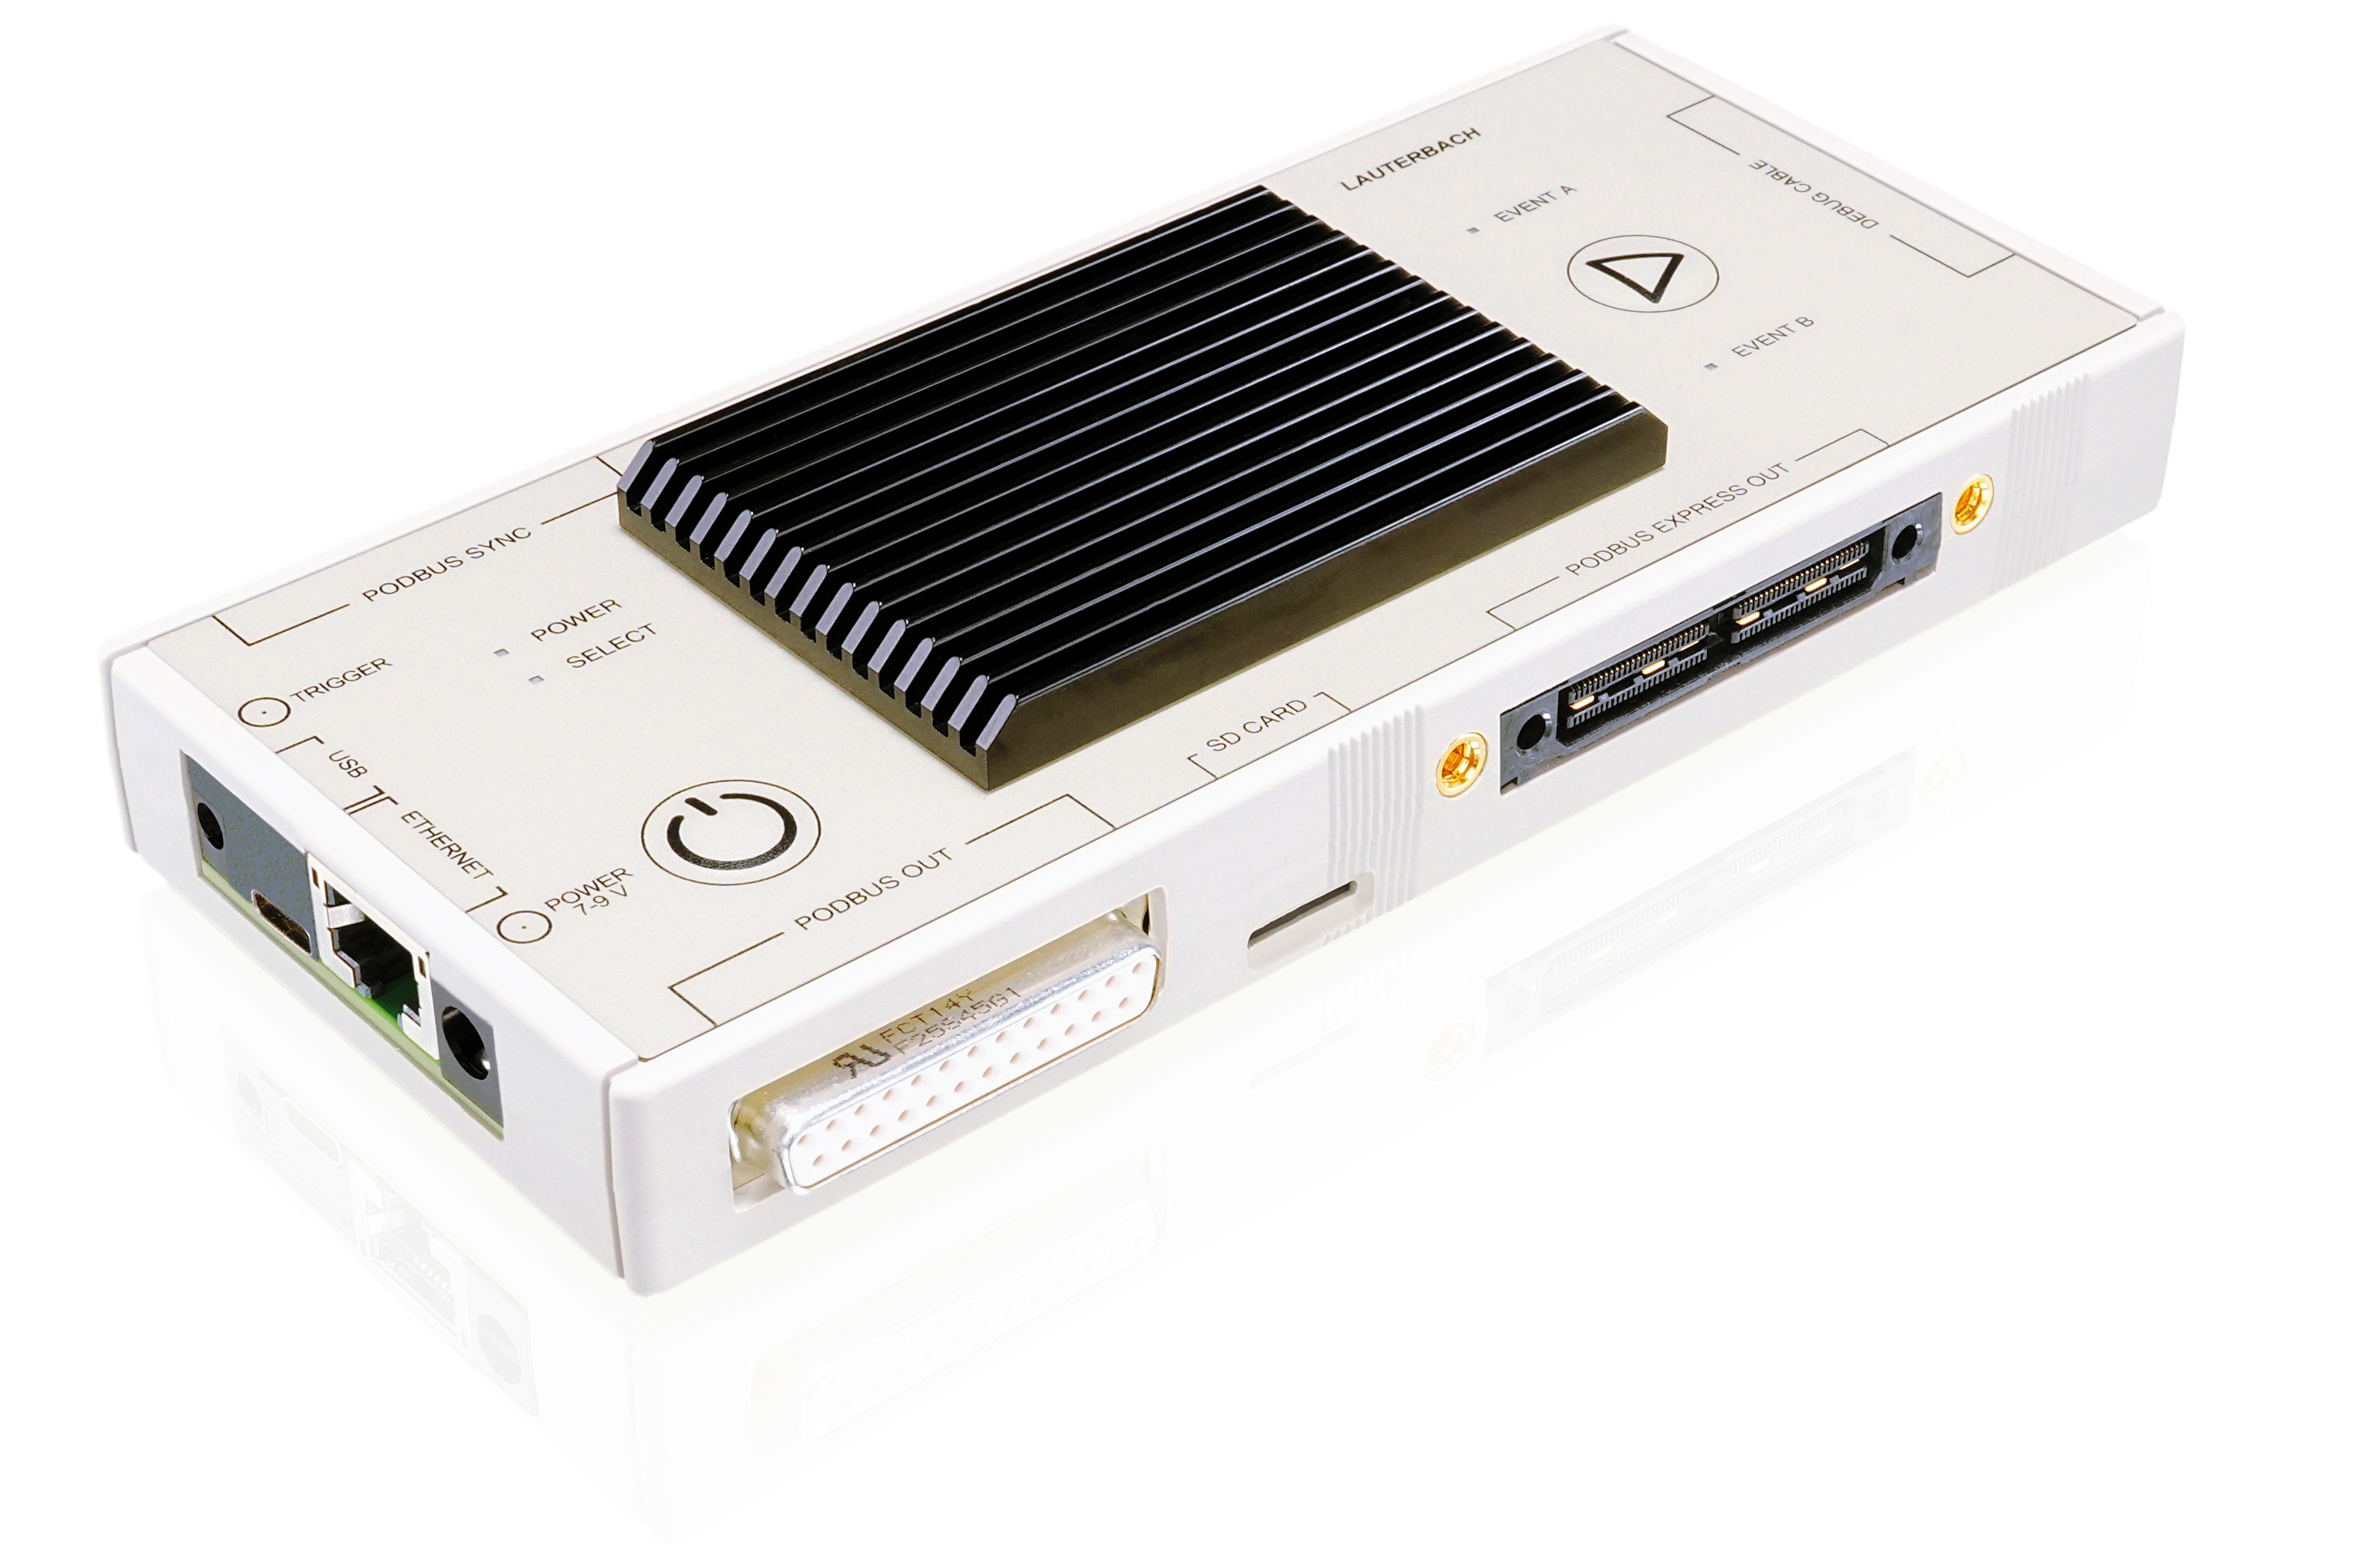
PowerDebug System
PowerDebug is a powerful, modular, flexible debug system that adapts and grows with you as you move from project to project and chip to chip. It provides the broadest coverage of supported chips and core architectures in the embedded industry.
Start with a universal PowerDebug module and target-specific debug probe. Extend your debug system with trace and logic analyzer modules for run-time analysis, code coverage, or in-depth troubleshooting.
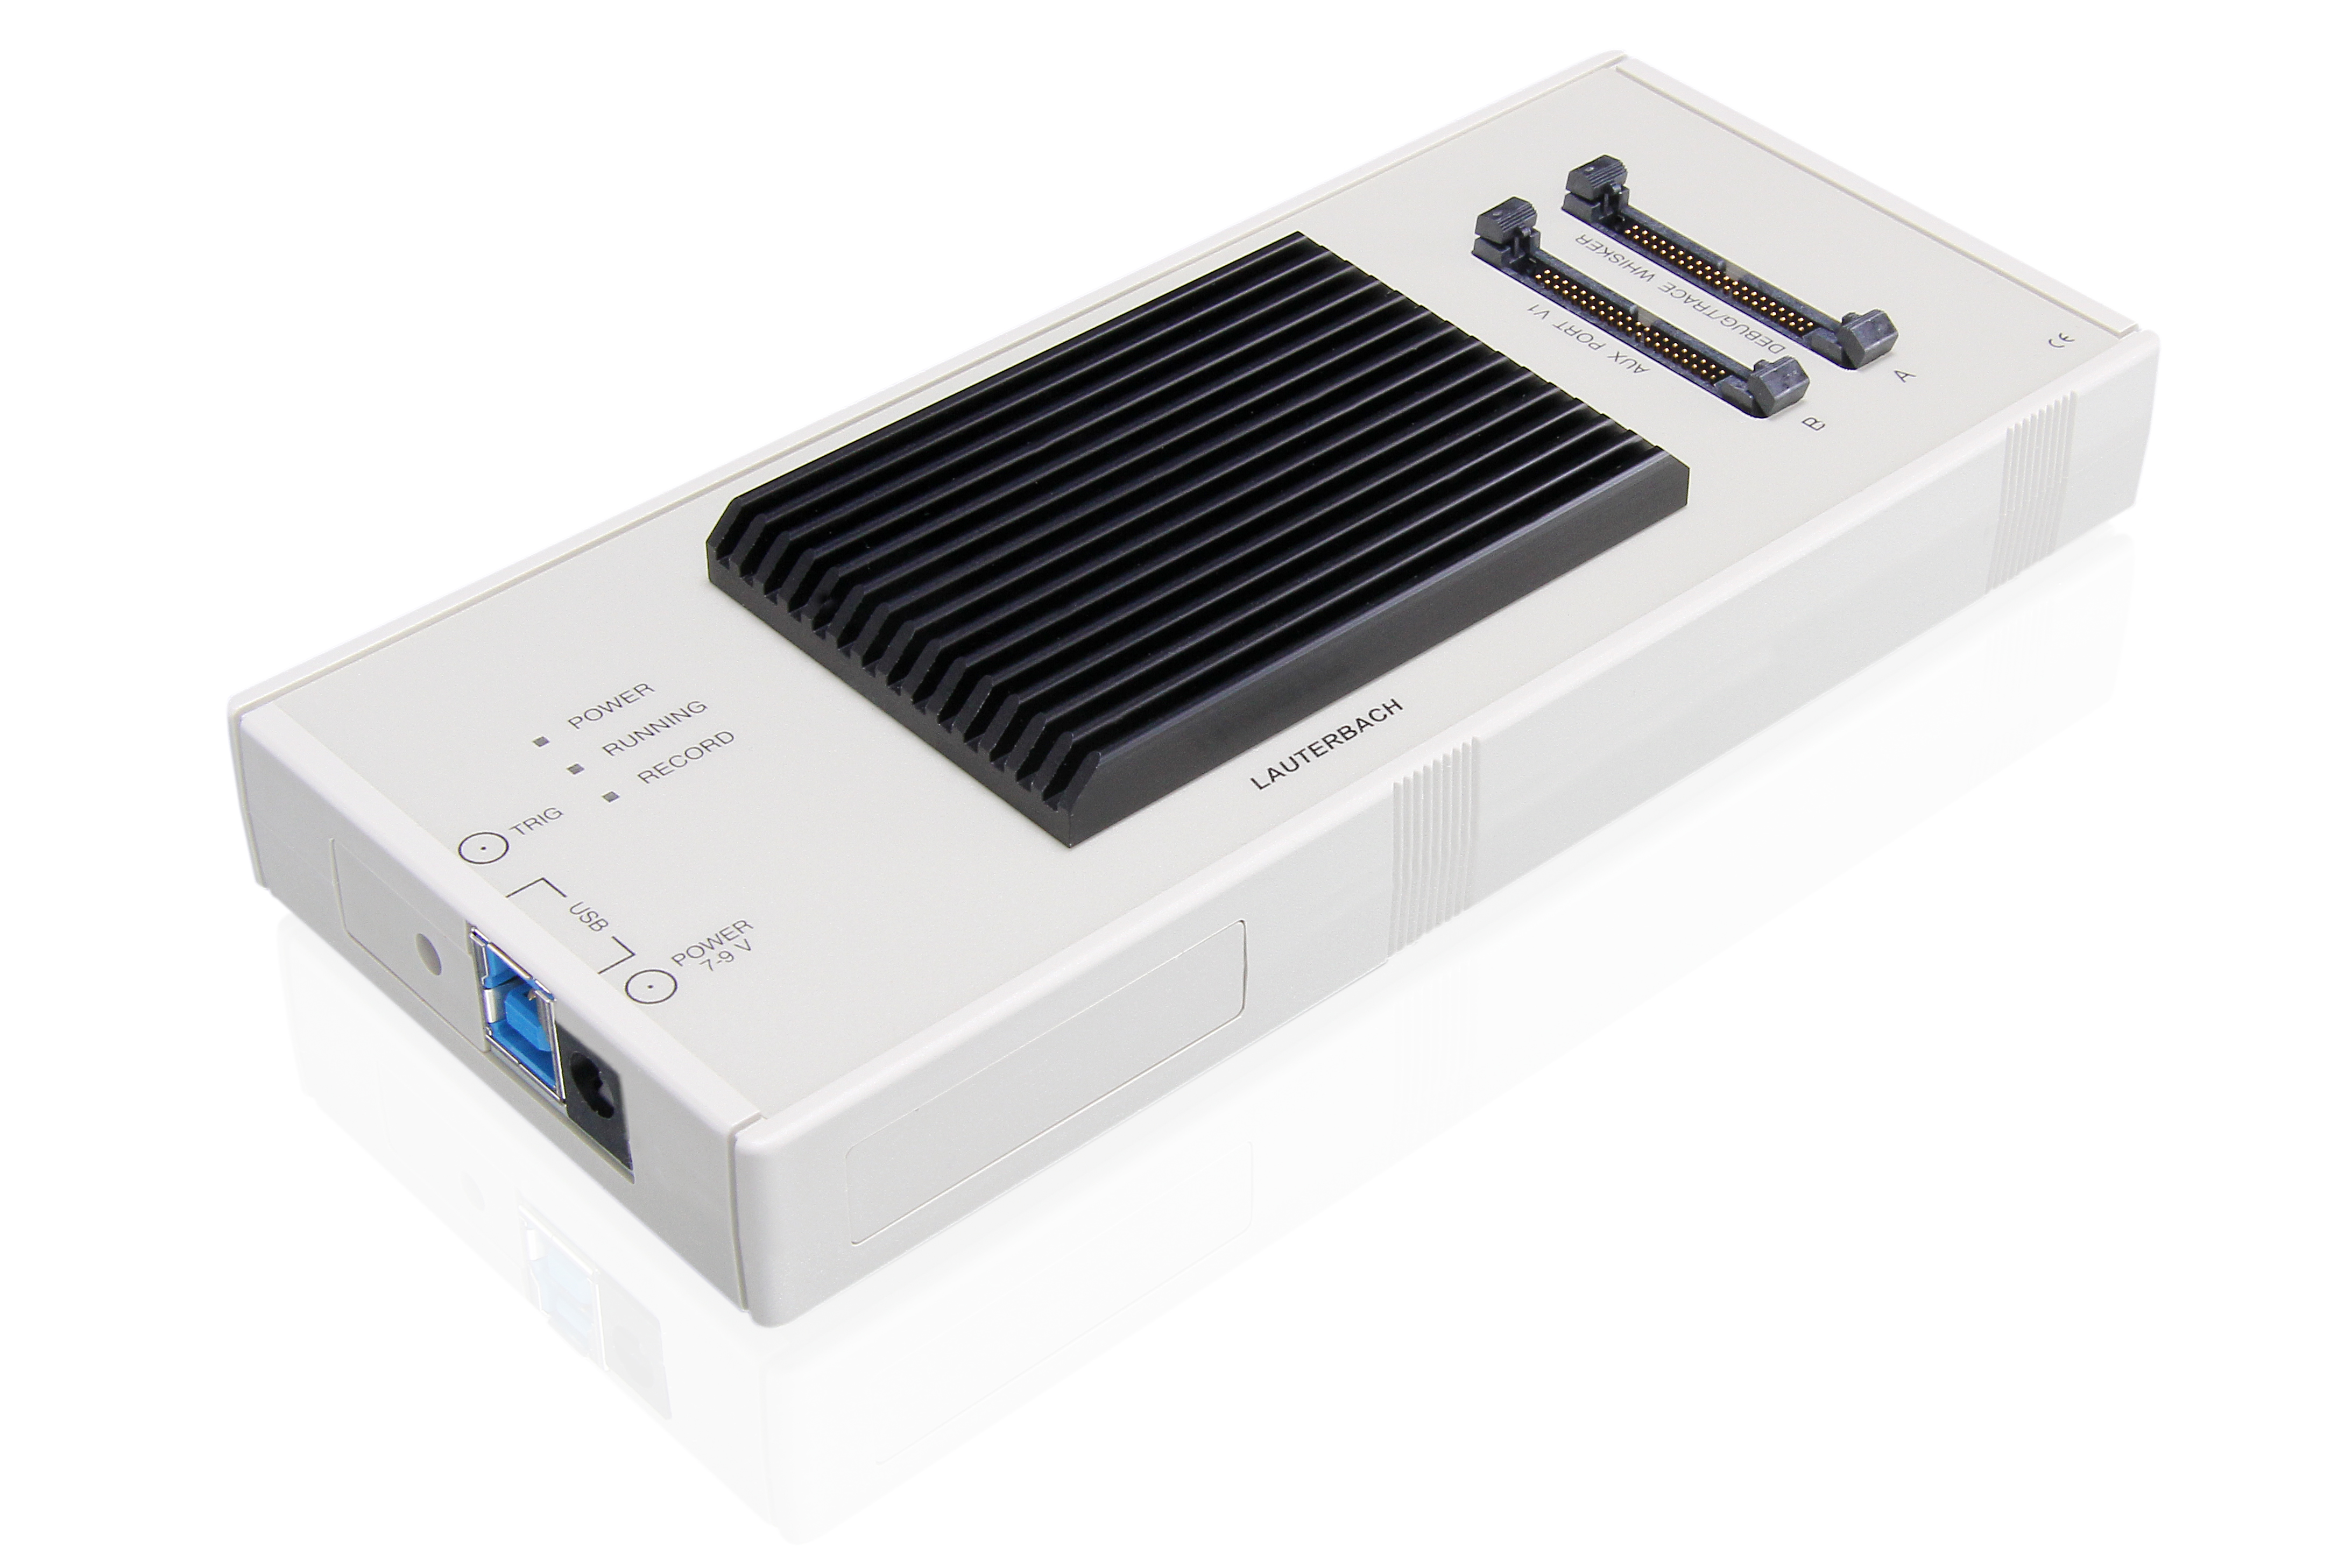
μTrace
Leverage the power of a full debug and trace system specifically geared towards your embedded design. µTrace® is our cost-effective all-in-one solution that provides all functions for Arm® Cortex®-M or RISC-V RV32 cores, and shines especially for microcontrollers with a parallel trace port of up to 4 pins.
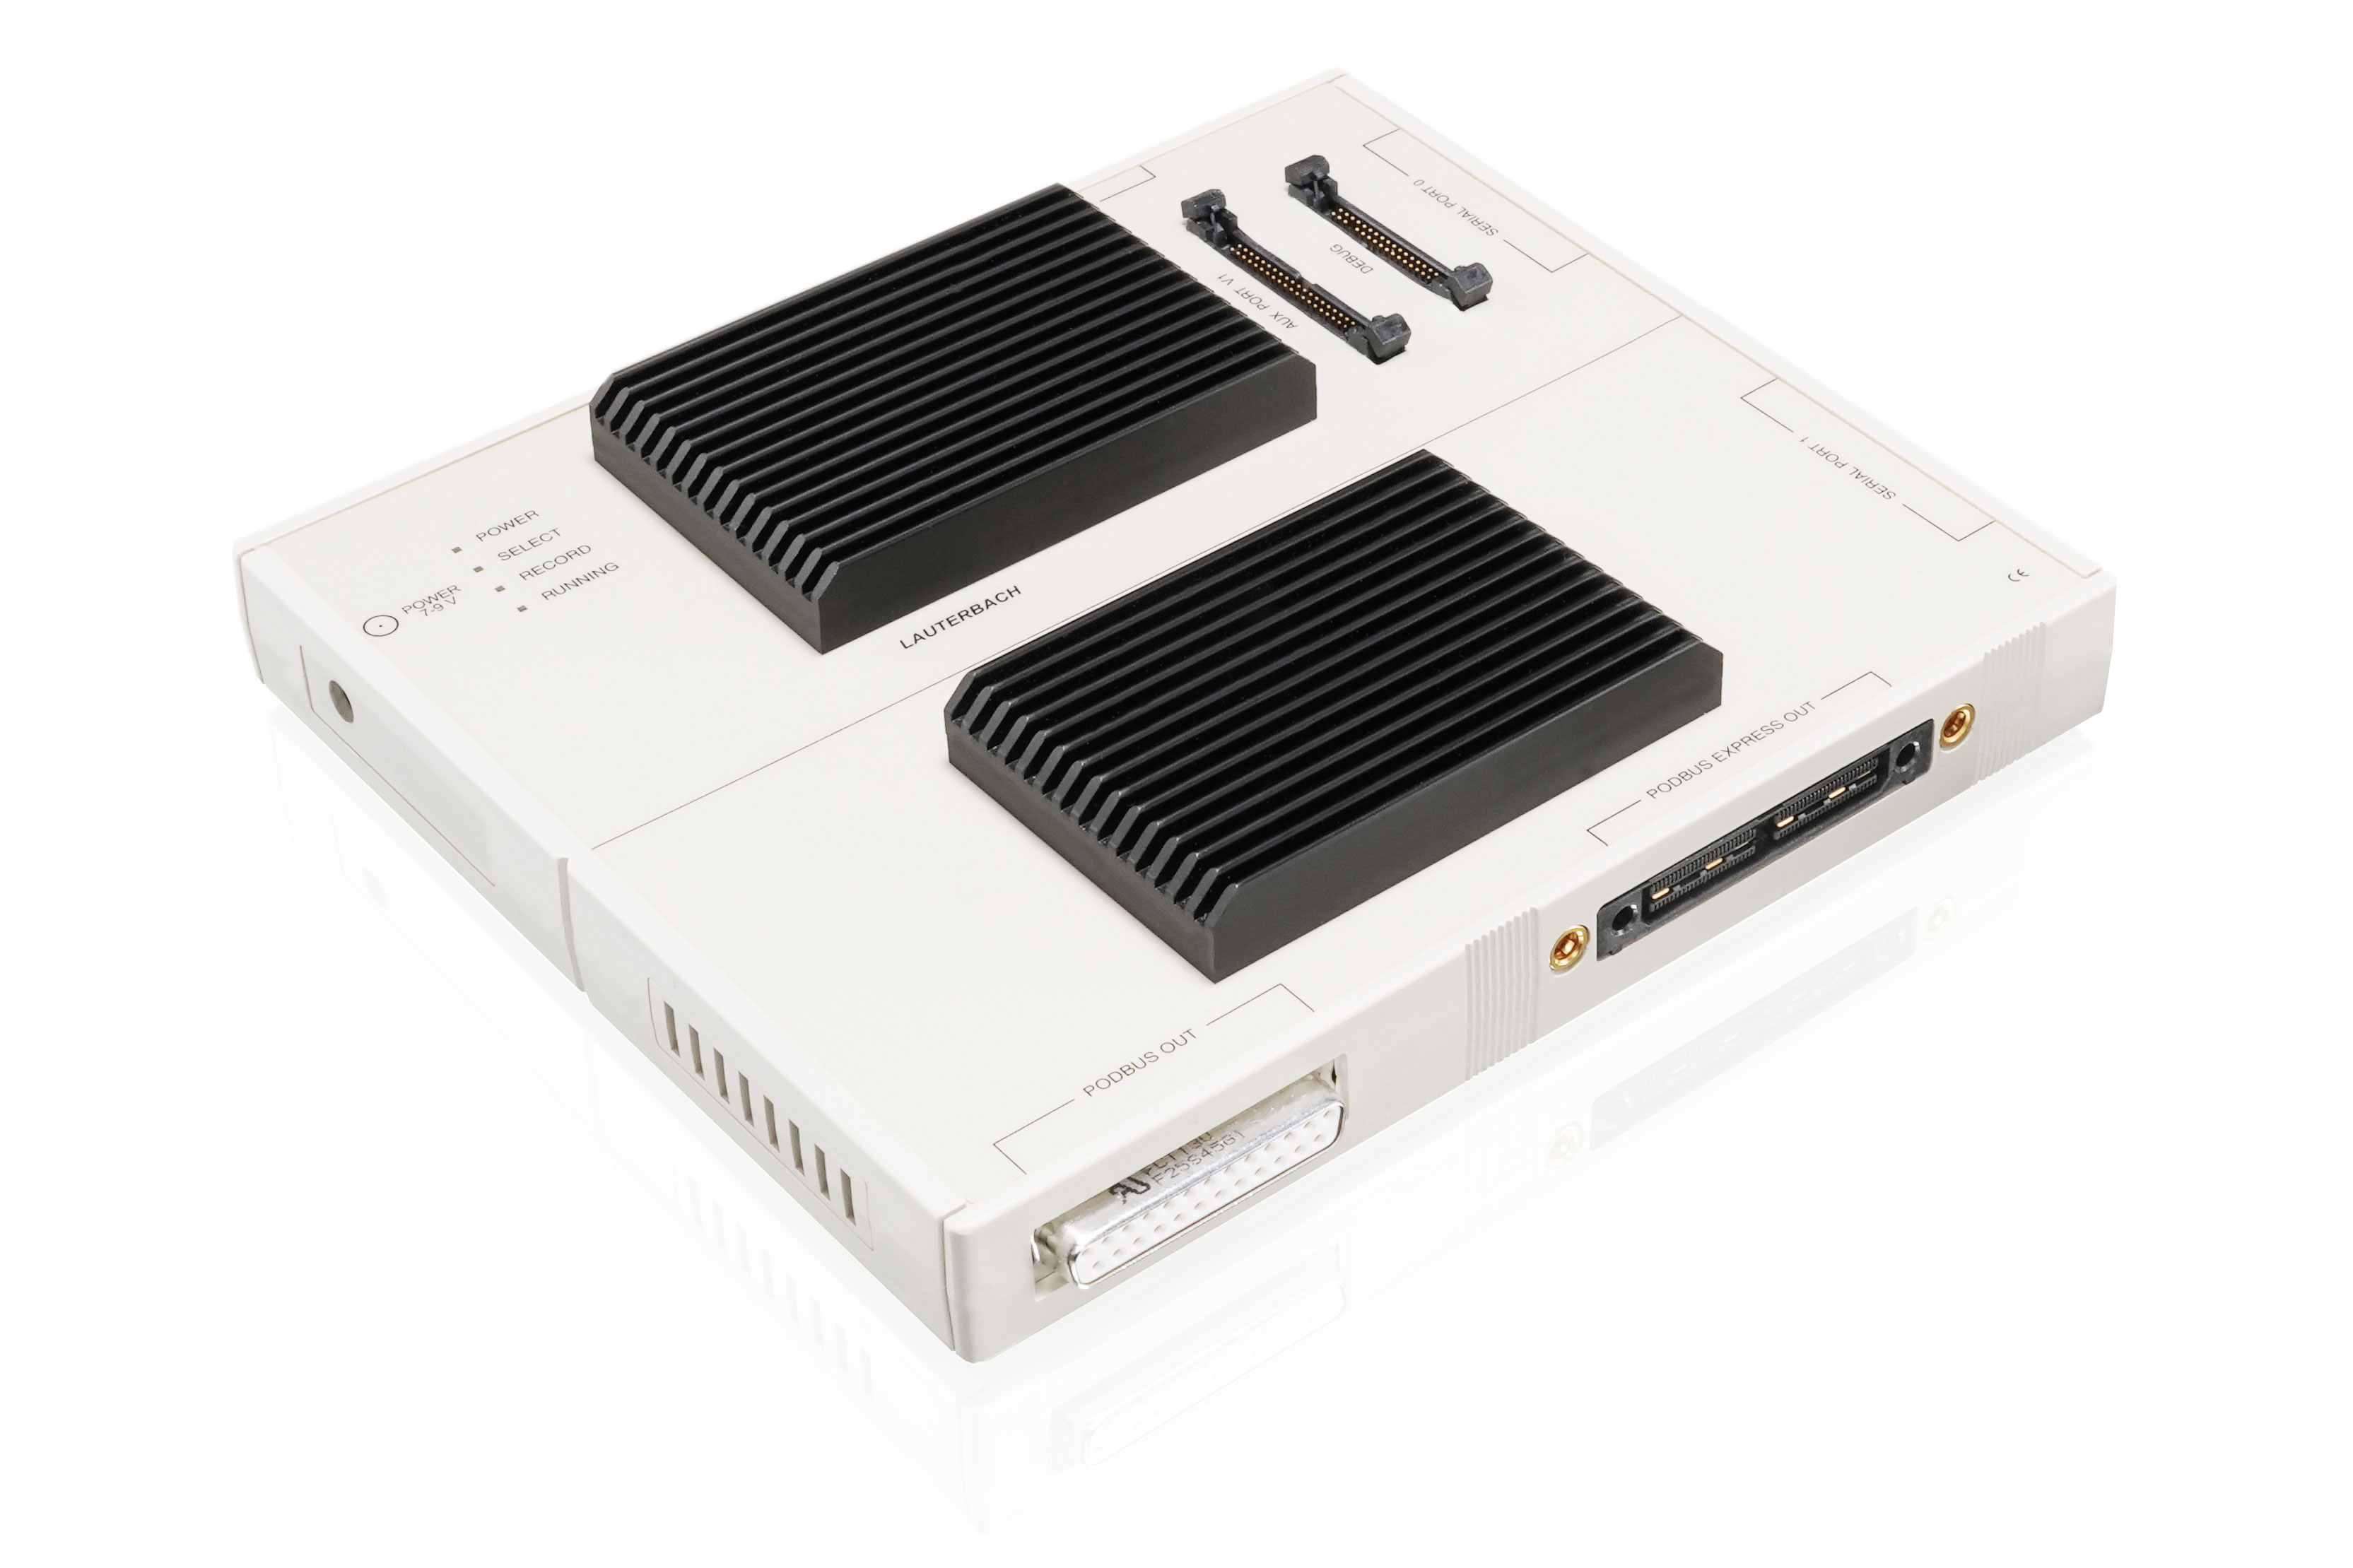
PowerTrace System
Imagine you have full insights of what your embedded system is doing without impacting its real-time performance in any way, creating a record of each step along the way. You could determine the performance of your application and coverage data for certifying your safety critical application. You could bring your embedded designs to market faster and more reliably than ever, while creating a safer and more stable product. This is what trace-based debugging gives you.